

Chengran (Felix) Guan
2026-08-31 · 11 min read
Real Estate Video Analytics:
How Agents Measure Video ROI in 2026
Most agents measure real estate video with one number: views. That is the least useful metric you track. Views tell you how many thumbnails got clicked; they tell you nothing about whether a video produced an inquiry, a showing, or a listing. In 2026, agents who turn video into business measure what happens after the view. This guide gives you a working system: three layers of metrics (reach, engagement, outcomes), real benchmarks to compare against, and a monthly scorecard you can set up in an afternoon.
Key Takeaways
- Views are a vanity metric. Reach matters, but it is the first layer of the funnel, not the result.
- Track three layers: reach (views, watch time), engagement (saves, shares, comments, DMs), and outcomes (leads, showings, listings).
- Engagement predicts business. A save or a share is a stronger signal than a view, because the viewer acted on it.
- Buyer behavior is the benchmark: 83% of buyers rate photos as very useful in their search, and video is the complement that separates memorable listings from forgettable ones (NAR research).
- Consistency beats virality. A monthly scorecard turns scattered numbers into decisions: keep what works, fix what does not, double down on what converts.
Why Views Are a Vanity Metric
A view is a glance. On most platforms, a view counts after a few seconds of playback — sometimes as little as three seconds. A thumbnail that promises something interesting can pull thousands of views and produce zero inquiries. Real estate video is a local, high-consideration purchase. You are not building a mass audience; you are building trust with a few dozen serious buyers per listing. Measuring yourself on views is like judging a listing by how many cars drove past the open house sign.
What a View Actually Means
Each platform defines views differently, and the definitions keep changing. The useful question is not "how many views did I get?" but "how many viewers watched long enough to absorb the message?" Watch time and completion rate filter out the drive-bys. A 30-second listing reel that 40% of viewers finish beats a 90-second tour that 5% finish.
The Three-Layer Metric Stack
Build every report around three layers:
- Reach — views, impressions, watch time. Tells you whether your content is being shown and watched.
- Engagement — saves, shares, comments, DMs, profile visits. Tells you whether viewers found it useful enough to act.
- Outcomes — inquiries, showing requests, signed listings, new seller conversations. Tells you whether the video moved your business.
Most agents stop at layer one. The agents converting video into listings report on all three. Which videos actually drive calls and offers is a strategy question we cover in depth in our guide to real estate video content that converts.
| Vanity Metrics | Business Metrics |
|---|---|
| Views | Watch time and completion rate |
| Likes | Saves, shares, comments, DMs |
| Follower count | Inquiries and showing requests |
| "It got 50,000 views" | "It produced two signed listings" |
The Metrics That Predict Business Results
Saves and Shares Predict Intent
A save means a viewer said "I want this later." For listing content, saves come from buyers comparing homes — your exact target audience. Shares mean a viewer said "someone I know needs this." Both are intent signals that correlate with inquiries far better than views do. If a listing video gets 200 views and 15 saves, that listing is working.
Comments and DMs Are Warm Leads
A comment like "where is this located?" or a DM asking for the address is a lead in disguise. Reply fast — within the hour when you can. Agents who respond to listing-video comments quickly convert a meaningful share of those conversations into showings. Make it a habit to check comments on every post for 48 hours after publishing.
Link Clicks Show Purchase Intent
Every video should push to a next step: your listing page, your site, or a direct "send me details" message. Link clicks and profile visits are the bridge between engagement and outcomes. If a video produces views but zero link clicks, the call to action is the problem — fix the ask before you change the content. For guidance on what to publish across each platform, see our real estate video platform guide for Instagram, TikTok, and YouTube Shorts.
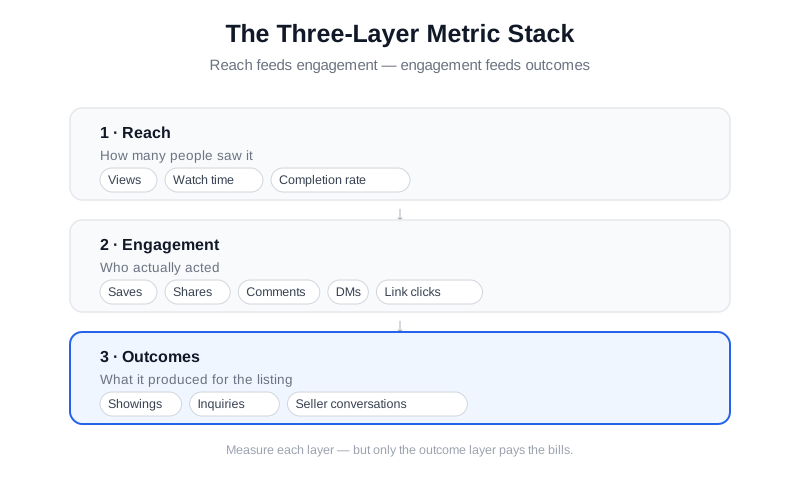
The three-layer metric stack: reach feeds engagement, engagement feeds outcomes.
How to Structure a Real Estate Video Presentation
The strongest real estate video presentation follows the order buyers already expect: a two-to-three-second hook, an establishing shot of the front, a walkthrough in the order people move through the home, and one clear call to action at the end. The hook does the heavy lifting — most viewers decide within the first few seconds whether to keep watching, so open on the most striking feature, not a logo. Write the sequence down before you film, even as a five-line note on your phone, and every video comes out consistent. That consistency is what makes your analytics comparable from one month to the next.
A real estate explainer video is a specific kind of presentation: it answers one question a buyer or seller actually asks, such as how to buy a first home, what a market update means for pricing, or how the closing timeline works. These run 45 to 90 seconds and earn the highest save and share rates because they teach instead of sell. That is why 96% of people have watched an explainer video to learn about a product or service — the format works just as well for a listing market as it does for software.
Real estate Reels are the discovery layer of the same presentation: 15 to 30 second vertical clips cut from your tour footage and posted where new buyers actually scroll. A Reel rarely closes a deal on its own, but it is how strangers find you. Measure each format differently — Reels on reach and profile visits, explainer videos on saves and shares, and full listing presentations on link clicks and inquiries. For a room-by-room plan, follow our listing video shot list, and for the tools to assemble each cut, see our real estate video maker guide.
Real Estate Video Benchmarks for 2026
You need comparison points or every number feels ambiguous. Start with buyer behavior, then use platform ranges.
- Photos still anchor the search: 83% of buyers rate photos as "very useful" in their home search — the highest of any listing content type, according to NAR research.
- Video and tours complement photos: 41% of buyers rate virtual tours as "very useful," which is why listing video is now table stakes for serious agents (NAR).
- Video is where attention lives: the average person watches about 17 hours of online video per week, and 96% of people have watched an explainer video to learn about a product or service (Wyzowl).
- Sellers reward video marketing: 73% of homeowners say they are more likely to list with an agent who uses video (NAR).
Platform Benchmarks
Use these as starting ranges, not laws. Short-form video (Reels, Shorts, TikTok) rewards clips of 15 to 60 seconds, where watch time and completion rate matter more than raw views. For listing tours, aim for 60 to 90 seconds — Wistia's State of Video research consistently shows this band holds attention best, and it fits a walkthrough. A local market update runs 45 to 75 seconds. Anything longer needs a reason: a full neighborhood guide, a live open house, or a seller-facing recap.
How to Build a Monthly Video Scorecard
Measurement only pays off if it changes what you publish. A monthly scorecard — one page, five columns — turns raw numbers into decisions in about 30 minutes.
The Five-Column Scorecard
List every video you published that month in rows: video name, platform, views (with watch rate), engagement (saves, shares, comments, DMs), and outcomes (inquiries, showings). Total each column at the bottom. That is the whole system. After three months, patterns appear: listing walkthroughs drive DMs, market updates drive saves, agent-intro videos drive seller conversations. Publish more of what the pattern favors.
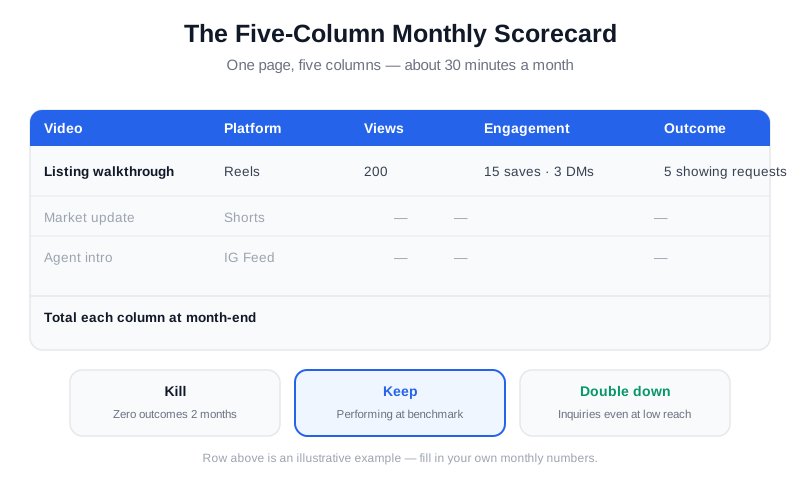
A five-column monthly scorecard turns video numbers into decisions.
Kill, Keep, Double Down
Sort every video into three buckets each month. Kill: formats with low completion and zero outcomes two months running. Keep: formats performing at benchmark. Double down: formats generating inquiries or listings, even with modest reach. This triage beats any analytics tool on the market. Pair it with the publishing cadence and channel plan in our real estate video marketing strategy guide.
Weekly Glance, Monthly Review
Glance at the numbers weekly — five minutes, just reach and engagement, to catch a video that is suddenly taking off. Do the full scorecard monthly. A weekly glance keeps you responsive; a monthly review keeps you strategic. Trying to analyze everything every day produces analysis paralysis, not better videos.
From Views to Inquiries: Attribution Without Fancy Tools
The hardest question is "did this video win this client?" You do not need a marketing cloud to answer it. You need three habits.
Ask Every New Lead Where They Found You
Put the question in your scripts: "How did you hear about us?" — listing, video, referral, sign. Log the answer in your CRM or a spreadsheet. After twenty leads, patterns appear: which video format, which platform, which listing produced them.
Put a Next Step in Every Video
End every video with one specific ask: "DM me for the full details," "Comment 'info' and I will send the sheet," or a link to the listing page. Videos without an ask generate views; videos with an ask generate leads. If you publish across multiple channels, our guide to repurposing one listing into 30 pieces of content shows how to adapt the same ask to each platform.
Track Listing-Level Results
For each listing, note showing requests and days on market alongside the video's numbers. A listing video that produces five showing requests in the first week is doing its job regardless of total views. This listing-level view connects video directly to the outcome that matters to your seller — and it is the proof you take into listing presentations. Pull local market context for those conversations from sources like Realtor.com research and your MLS reports.
Measuring AI-Produced Video the Same Way
AI editing changes how fast you produce video, not how you measure it. In fact, automation makes measurement easier: consistent templates mean consistent formats, and consistent formats produce comparable numbers. When every market update follows the same structure, you can isolate what actually changed performance — the subject, the call to action, the timing.
VideoGuru produces listing videos, market updates, and social clips from your photos and footage, with templates and auto-captions that keep output consistent week after week. Beyond video, VideoGuru's photo editing tools handle your listing photography too — one-click virtual staging, decluttering, and color correction — so the same AI workflow covers your whole visual pipeline. Consistency in production gives you consistency in measurement, and that is what turns a video experiment into a pipeline you can forecast. To understand where AI video fits in the wider 2026 landscape, read our state of AI real estate video report.
Frequently Asked Questions
What is a good engagement rate for real estate videos?
Engagement rate is saves, shares, comments, and DMs divided by views. For short-form real estate video, a combined engagement rate above 5% is strong, and above 10% is exceptional for a local account. Compare your own videos month over month first — beating your own baseline matters more than hitting someone else's number.
How do I know if a video led to a sale?
Ask every new lead how they found you, log the answer, and review the pattern every few weeks. Track listing-level results too: showing requests, offers, and days on market for listings that had video. You may never get a perfect attribution line, but after 20 to 30 logged leads you will see which formats and platforms produce business.
How often should I post video to get measurable results?
Consistency is the multiplier. One video per week for three months gives you a dataset; three videos per week gives you one faster. The reliable pattern is three to five short videos per week on your platform of choice, plus a listing video whenever you take a new listing. If that cadence is too much to produce manually, AI-assisted editing is built for exactly this problem.
Do views matter at all?
Yes, but only as the first layer. Views are the top of your funnel — if nobody sees the video, nothing else happens. The mistake is treating views as the result. Use views to check reach, then judge the video by engagement and outcomes.
What are the key elements of an effective real estate video storyboard?
A storyboard for a listing or brand video has five parts: a hook in the first two seconds, an establishing shot, a room-by-room walkthrough in the order a buyer moves through the home, one key feature highlighted per room, and a single call to action at the end. Storyboarding before you film cuts editing time roughly in half and keeps every video consistent enough to compare in your scorecard. Tools like VideoGuru, Canva, and CapCut turn a written storyboard into a finished cut with templates, so you do not have to build each frame from scratch. See our room-by-room shot list to start.
What is a real estate explainer video, and when should I use one?
A real estate explainer video answers one specific question a buyer or seller keeps asking — how to buy a first home, what a market update means for pricing, or how the closing timeline works. They run 45 to 90 seconds and target cold audiences, which is why they earn higher save and share rates than a straight sales clip. Use one whenever a question keeps coming up in conversations; you will see it outperform listing footage with new leads.
Ready to build a video library you can actually measure? VideoGuru's AI editing tools help you produce listing videos, market updates, and social clips on a consistent cadence — so you have the data to see what works. Start for free at VideoGuru.
The Bigger Picture
Video is a compounding asset, and measurement is what makes it compound. Every video you publish adds a data point about what your market responds to. Agents who review numbers monthly stop guessing and start doubling down on what works. In 2026, the agents winning listings with video are not the ones with the most views — they are the ones who can prove, with their own numbers, that video produces inquiries, showings, and signed listings. Start tracking this month, review the scorecard next month, and let the data decide.