

Chengran (Felix) Guan
2026-09-23 · 16 min read
Real Estate Video Statistics:
40+ Numbers Agents Should Know in 2026
Nearly half of Realtors now use AI weekly or daily (48%), a little over half shoot drone photography or video (52%), and listings with video are widely reported to pull roughly four times the views of photo-only listings. Those are the headline numbers of real estate video in 2026. This page collects 40+ of them — agent adoption, AI use, buyer behavior, listing performance, and production cost — with the source and year attached to every figure, so you can quote them in a listing presentation instead of repeating a number you half-remember.
The statistics below come from three kinds of evidence, and the difference matters. Primary industry research (the National Association of Realtors’ annual surveys, Wyzowl’s State of Video Marketing) is measured and repeatable. Platform and market data (Zillow’s public market figures) is real but narrow. Widely cited figures — the 403% inquiry lift, the four-times-views claim, the 67% virtual-tour preference — circulate through dozens of marketing roundups with their original study rarely named. They are directional, not definitive, and this page labels them that way. Every number carries its label.
Key Takeaways
- AI adoption crossed the halfway line in 2026. 23% of Realtors use AI daily and another 25% weekly — 48% weekly or daily, per NAR’s 2026 Realtors Technology Report.
- Video hardware and virtual tours are already mainstream. 52% of Realtors use drone photography or video and 75% use social media, where most listing video lives (NAR 2025 Technology Survey).
- Time, not novelty, drives adoption. 66% of Realtors say they adopt new technology primarily to save time — the same reason photo-to-video tools exist.
- The famous performance numbers are directional. 403% more inquiries, 4x the views, and a 67% virtual-tour preference are repeated everywhere and traceable to small agency or portal studies, not peer-reviewed research. Quote them with the caveat.
- Buyers arrive already sold on visual media. About 97% of buyers use the internet during their search, and 83% of buyers’ agents say staging makes it easier for buyers to picture the home as theirs (NAR).
- Production cost is the number agents can actually control. On published AI plans, the effective cost lands between $8.94 and $12.00 per video on annual billing; free tiers cap out at 2 videos a month, 720p, and 15 seconds.
How to Read These Numbers (and Which Ones to Trust)
Real estate video statistics have a provenance problem. The same six numbers appear in hundreds of blog posts, agency decks, and vendor pages, usually without a link to the original study, and often with the year quietly removed. When a figure has been copied that many times, it stops looking like an estimate and starts looking like a fact.
So every number on this page carries one of three labels:
- Sourced: measured by a named body in a dated report — NAR’s Realtors Technology Report, NAR’s Profile of Home Buyers and Sellers, Wyzowl’s State of Video Marketing, Zillow’s published market data. Safe to quote with attribution.
- Directional: a widely repeated industry figure whose original study is small, old, or unnamed. Safe to use with the words “industry data suggests” — not as a hard promise to a seller.
- Published plan data: pricing and limits taken directly from a platform’s own product code and pricing page, which change over time but are exact on the date they are checked.
One more note on what is not here: you will not find our competitors’ internal marketing claims in this list. If a number only exists on a vendor’s sales page and has no methodology behind it, it did not make the cut.
The primary sources behind the sourced figures, if you want to read them yourself: NAR’s Realtors Technology Survey and the association’s 2025 technology findings; NAR’s 2025 Profile of Home Buyers and Sellers; the trade coverage of the 2026 Realtors Technology Report and its AI task breakdown; Wyzowl’s State of Video Marketing; and Zillow’s market data.
Agent Adoption: How Many Realtors Actually Use Video and AI?
Start with the adoption picture, because it explains the opportunity. NAR’s 2026 Realtors Technology Report, released September 22, found that AI has moved from experiment to habit: 23% of Realtors use AI daily, another 25% use it weekly, and the single most common use case is writing listing descriptions (75% of AI users). The 2025 survey showed the same pattern one layer down — the tools Realtors actually pay for are the ones that save hours, not the ones that look impressive in a demo.
| Statistic | Number | Source |
|---|---|---|
| Realtors using AI daily | 23% | NAR 2026 Realtors Technology Report |
| Realtors using AI weekly | 25% | NAR 2026 Realtors Technology Report |
| Realtors using AI weekly or daily | 48% | NAR 2026 Realtors Technology Report |
| AI users who use it for listing descriptions | 75% | NAR 2026 Realtors Technology Report |
| AI users who use it for social media posting | 56% | NAR 2026 Realtors Technology Report |
| AI users who use it for emails and follow-ups | 52% | NAR 2026 Realtors Technology Report |
| Realtors using eSignature | 79% | NAR 2025 Realtors Technology Survey |
| Realtors using social media | 75% | NAR 2025 Realtors Technology Survey |
| Realtors using drone photography or video | 52% | NAR 2025 Realtors Technology Survey |
| Realtors using AI-generated content | 46% | NAR 2025 Realtors Technology Survey |
| Realtors who pay for their own social media tools | 52% | NAR 2025 Realtors Technology Survey |
| Realtors who pay for their own cloud storage | 48% | NAR 2025 Realtors Technology Survey |
| Realtors who pay for their own virtual tours | 47% | NAR 2025 Realtors Technology Survey |
| Realtors who adopt new tech primarily to save time | 66% | NAR 2025 Realtors Technology Survey |
| Social media as the top lead-generating technology | 39% | NAR 2025 Realtors Technology Survey |
| CRM as a top lead-generating technology | 23% | NAR 2025 Realtors Technology Survey |
| Local MLS as a top lead-generating technology | 17% | NAR 2025 Realtors Technology Survey |
Sources: NAR 2026 Realtors Technology Report (released September 22, 2026) and the NAR 2025 Realtors Technology Survey (September 2025).
What percentage of real estate agents use video?
There is no single clean number, and anyone who quotes one is guessing. NAR’s technology survey measures drone photography or video (52%), separate from virtual tours, and does not publish a standalone “listing video” line item. The closest honest answer for 2026: about half of Realtors are already capturing or buying video assets, three quarters are on the social platforms where video wins reach, and roughly half now use AI weekly — but consistent, per-listing video coverage is still a minority practice. That gap is the entire opportunity. Agents who cover every listing with a walkthrough are competing against a market where most listings still have none.
The practical constraint is no longer gear or editing skill, it is time — which is exactly what the 66% “save time” figure points at. If you have been putting off video because a shoot eats half a day, the fastest path in is the one that reuses the listing photos you already have: upload the set, let the platform assemble a walkthrough, and review the export. Our 10-minute listing video workflow walks through that path end to end.
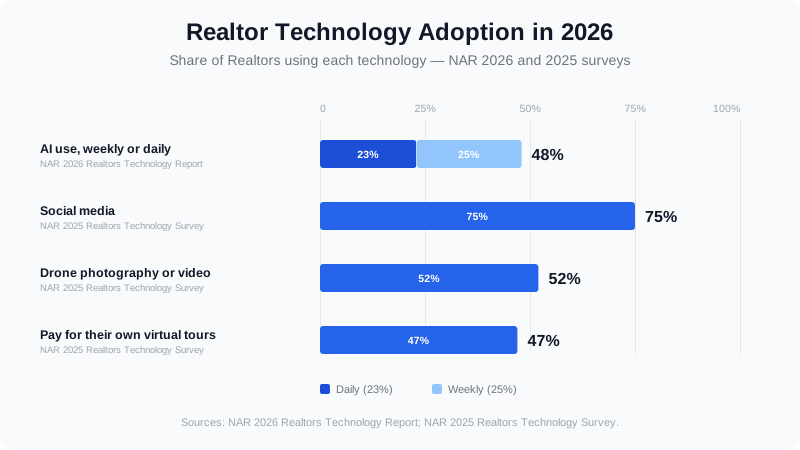
Where Realtor adoption sits in 2026: AI use is climbing fastest, while video capture and social media are already mainstream.
Listing Performance: What Video Does to Views, Inquiries, and Days on Market
This is where the industry’s most quotable numbers live — and where you need to be most careful. The directional figures below are repeated in nearly every real estate video roundup published since 2018. They all point the same way, and none of them comes with a published methodology you can inspect.
| Statistic | Number | Type |
|---|---|---|
| More inquiries on listings with video | 403% | Directional |
| Listings with video are more likely to be viewed | ~4x | Directional |
| Engagement lift on listings with professional video | 118% | Directional |
| Agents who say video marketing grows revenue faster | 49% faster | Directional |
| Buyers who prefer listings that include a virtual tour | 67% | Directional |
| Buyers who would not consider a home without a virtual tour | 54% | Directional |
| Buyers’ agents who say staging helps buyers visualize the home | 83% | NAR Profile of Home Staging |
| Shares of U.S. sales closing above list price (July 2026) | 30.2% | Zillow market data |
Directional figures are widely cited across industry roundups with original studies that are small, undated, or unnamed. NAR and Zillow figures are measured.
Do listings with video sell faster?
Probably, but the clean causal evidence is thinner than the roundups suggest. The commonly repeated claim is that video tours help a home sell meaningfully faster than photo-only listings, and every agent who has run both formats on comparable properties will tell you the video listing gets more showings. What the public data supports is the direction: buyers prefer visual media, listings with more and better visuals attract more engagement, and listings that attract more engagement get more showings. The magnitude varies enormously by market, price band, and property type, which is why you should track your own listings rather than borrow someone else’s percentage. Our guide to measuring real estate video performance covers the metrics worth tracking.
Is the “403% more inquiries” statistic reliable?
Treat it as a headline, not a measurement. The figure has been copied across the industry for years without a traceable study behind it, and no one quoting it can tell you the sample size, the market, or the price band it came from. That does not make it useless — it makes it rhetorical. Say “industry data suggests listings with video draw far more inquiries” in a listing presentation and you are being accurate. Say “video will get you 403% more leads” and you are making a promise you cannot keep. The truthful version is also more persuasive, because it does not sound like a pitch.
The same discipline applies to the photos that feed your video. If a property needs a cluttered counter cleared, an empty room staged, or a flat gray sky replaced, fix the stills first with AI twilight and photo effects — a walkthrough assembled from weak photos inherits every weakness at video speed.
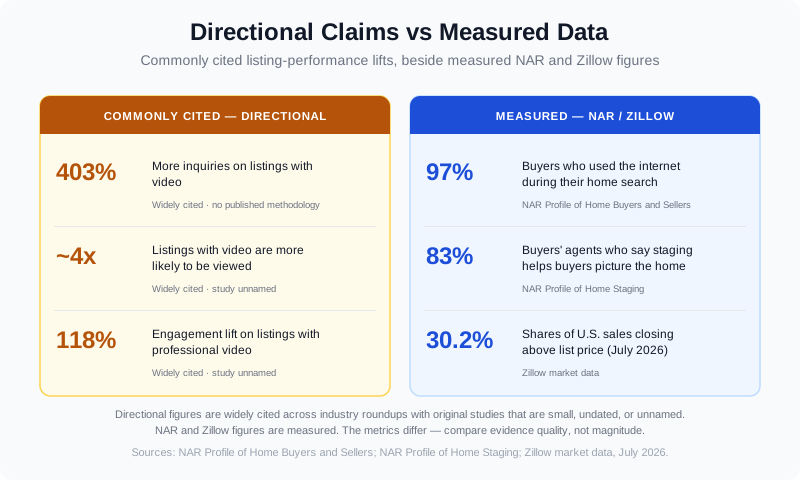
Directional marketing figures sit far above measured industry data - the direction is consistent, the magnitude is not.
Buyer Behavior: What Buyers Do Before They Ever Call You
Buyer-side numbers come from NAR’s Profile of Home Buyers and Sellers, which surveys people who actually closed a transaction in the previous year. They are the most reliable figures on this page, and they explain why visual media keeps winning: the decision is mostly made on a screen, before a single showing.
| Statistic | Number | Source |
|---|---|---|
| Buyers who used the internet during their home search | 97% | NAR Profile of Home Buyers and Sellers |
| First-time buyer share of purchases (2025) | 21% | NAR Profile of Home Buyers and Sellers |
| Median age of a first-time buyer | 40 | NAR Profile of Home Buyers and Sellers |
| Median down payment, all buyers | 19% | NAR Profile of Home Buyers and Sellers |
| Median down payment, first-time buyers | 10% | NAR Profile of Home Buyers and Sellers |
| Median down payment, repeat buyers | 23% | NAR Profile of Home Buyers and Sellers |
| Buyers’ agents who say staging helps buyers visualize the home | 83% | NAR Profile of Home Staging |
| Buyers who prefer listings with a virtual tour | 67% | Directional |
| Buyers who would not consider a home with no virtual tour | 54% | Directional |
NAR figures are from the 2025 Profile of Home Buyers and Sellers (buyers who closed between July 2024 and June 2025) and the NAR Profile of Home Staging.
The read-across for a listing agent: the buyer who calls you has usually already filtered your property in or out on a screen. A listing with eighteen photos and no motion competes against one with a 60-second walkthrough, a twilight exterior, and a floor-plan graphic — and the second listing gets the click. That is why the photographers and media companies that scaled fastest in the last two years did not add cameras, they added production: one shoot, many assets. If stills are your business, our breakdown of how photographers added AI photo-editing revenue and how one photographer doubled revenue by selling video alongside stills shows the commercial case.
Marketing Benchmarks: Video Across Every Channel You Post To
Real estate sits inside a much bigger video market, and the general benchmarks are worth knowing because they set buyer expectations before someone ever sees your listing. Wyzowl’s State of Video Marketing is the longest-running consumer and marketer survey in the category, and its 2026 edition shows video is now standard practice rather than a differentiator.
| Statistic | Number | Source |
|---|---|---|
| Businesses that use video as a marketing tool | 91% | Wyzowl State of Video Marketing 2026 |
| Marketers who say video is important to their overall strategy | 93% | Wyzowl State of Video Marketing 2026 |
| Marketers who say video delivers a good ROI | 82% | Wyzowl State of Video Marketing 2026 |
| Consumers who want to see more videos from brands | 84% | Wyzowl State of Video Marketing 2026 |
| Consumers who prefer to learn about a product via short video | 63% | Wyzowl State of Video Marketing 2026 |
| People who have watched an explainer video to learn about a product | 96% | Wyzowl explainer video data |
| Lift in landing-page conversion when a video is present | up to 86% | Industry video roundups |
| Weekly Instagram Reels cadence, average real estate brand | 3 | Dash Social benchmark data |
| Weekly TikTok cadence, average real estate brand | 2 | Dash Social benchmark data |
| U.S. adult screen time spent on digital video (projected 2026) | over 60% | Statista |
Wyzowl and Statista figures are from named, dated surveys and reports; the conversion lift and posting cadence are directional benchmark figures.
Two numbers to act on. First, 63% of consumers would rather learn about something through a short video than any other format — so the 45-second vertical cut of your walkthrough is not an afterthought, it is the primary ad. Second, the average real estate brand posts only about three Reels and two TikToks a week, the lowest cadence in social benchmarking studies. Volume is cheap relative to the reach it buys, which is why platforms that turn one photo set into multiple cuts change the math. Our breakdown of real estate Reels and the video content that actually converts cover the format side; repurposing one listing into a week of content covers the workflow side.
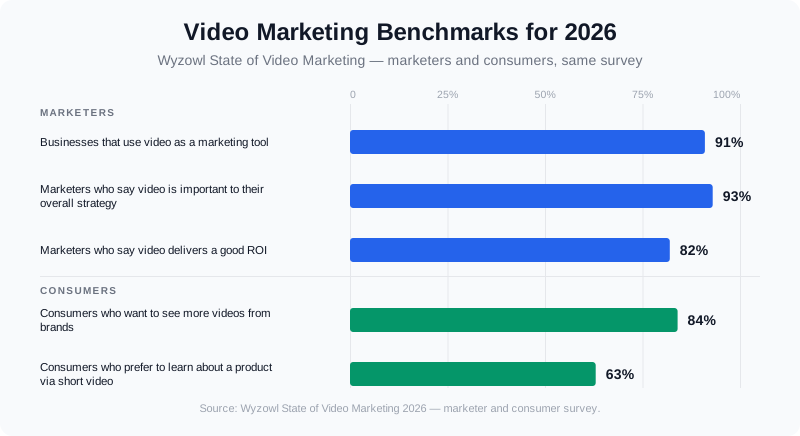
Video adoption, ROI sentiment, and buyer preference - the benchmarks that now set buyer expectations for listing media.
Cost Numbers: What a Listing Video Costs to Produce in 2026
Cost is the statistic agents can actually control, so it is worth being precise about it. There are three ways to get a listing video in 2026, and they sit in completely different price bands: film and edit it yourself, outsource a filmed production, or assemble a walkthrough from the photos you already have.
In the markets we have profiled, freelance editing of an existing photo or footage set typically runs somewhere in the low hundreds of dollars per video, while a full filmed production day with a crew is a four-figure line item before revisions. Both are ranges that move with market, crew size, and square footage — our 2026 production cost breakdown walks through each driver. The third route, AI photo-to-video, is priced per seat and per credit rather than per project, which is why its effective cost per delivered video is now the lowest of the three.
| Published plan (annual billing) | Price | Videos included | Effective cost per video |
|---|---|---|---|
| Essential, yearly | $30/mo ($360/yr) | ~30/yr | $12.00 |
| Growth, yearly | $85/mo ($1,020/yr) | 100/yr | $10.20 |
| Pro, yearly | $149/mo ($1,788/yr) | 200/yr | $8.94 |
| Essential, monthly | $59/mo | ~3/mo | — |
| Growth, monthly | $129/mo | ~10/mo | — |
| Pro, monthly | $249/mo | 25/mo | — |
| Free tier | $0 | 2/mo (720p, up to 15s, watermarked) | — |
VideoGuru published plan data. Effective cost per video uses every included credit on an annual plan: annual price divided by annual video count.
A few product details matter when you compare this to a per-project invoice. Every paid plan includes the same photo and clip capacity per video — 20 photos and up to 40 clips, including your own drone footage or real-person clips mixed into the same walkthrough — and Growth and Pro render at 4K while Essential renders at 1080p. Output comes in three aspect ratios (16:9, 1:1, 9:16), so the portal cut and the vertical social cut come from one project instead of two. Unused credits roll over for 3 months on monthly plans and 12 months on annual plans. The AI avatar and voice-cloning features that put a presenter and your cloned voice inside the walkthrough are included on any paid plan — there is no separate avatar subscription. If you are comparing that to hiring a human presenter or booking studio time, our breakdown of how long real estate videos actually take is the fairer comparison.
What These Numbers Don’t Say
Four caveats worth carrying into any conversation where you use these figures:
- Adoption is not causation. Teams that invest in video also invest in pricing, staging, photography, and follow-up. When their listings outperform, video gets the credit for a system’s work. Use video statistics to justify the experiment, not to prove the outcome.
- Sample sizes vary wildly. NAR surveys tens of thousands of members. Most of the dramatic performance percentages come from small agency studies, portal data of unknown scope, or surveys nobody can locate. Both are “industry data” — they are not the same quality of evidence.
- Definitions differ. “Engagement” can mean a three-second view, a click, a save, or a booked showing. Two roundups quoting the same number may be describing different things entirely.
- Vintage matters. A statistic about buyer behavior from before widespread virtual tours and AI video describes a market that no longer exists. Prefer the newest source, and prefer a dated one to an undated one.
The practical rule: quote the sourced numbers with their source, use the directional ones with a hedge, and measure your own listings for the decision that actually matters. Once you are producing video at near-zero marginal cost, the only metric that counts is whether your listing inquiries moved — and that is a number no roundup can give you.
Video in Practice
Adoption statistics tell you what the market is doing; they do not tell you what a listing video should look like. The short version: lead with motion in the first two seconds, show the exterior before the interior, keep a walkthrough to roughly a minute, and cut a vertical version with captions for social. If you want a longer orientation to how agents are putting AI and video to work in 2026, there is a good one below.
Frequently Asked Questions
What percentage of real estate agents use video in 2026?
There is no single authoritative figure, because NAR measures adjacent categories rather than a dedicated listing-video line. The closest measured proxies: 52% of Realtors use drone photography or video, 75% use social media (where most listing video is published), and 47% pay for virtual tours out of their own pocket. Consistent per-listing video coverage remains a minority practice, which is exactly why it still differentiates. If you want a defensible sentence for a listing presentation, use those three numbers rather than a roundup percentage.
Do listings with video sell faster and for more?
The direction is well supported and the magnitude is not. Every credible survey shows buyers prefer visual media and engage more with listings that have it, and listings that get more engagement get more showings. But the widely quoted “403% more inquiries” and “four times the views” figures come from studies whose methodology is rarely published, and sale-price effects depend far more on pricing and market conditions than on video. Treat video as a demand-generation tool, not a pricing tool, and track showings and inquiries on your own listings to find your market’s real number.
How much does an AI real estate video cost per listing?
On published annual plans, the effective cost is between $8.94 and $12.00 per video when you use every included credit — $12.00 on the entry tier, $10.20 on the middle tier, and $8.94 on the top tier. Monthly plans run $59, $129, and $249 and include fewer videos per cycle. Compare that with the low hundreds of dollars for freelance editing of an existing set, or a four-figure production day for a filmed shoot, and the cost question usually answers itself for standard listings. Filmed production still makes sense for architectural and luxury properties where the property itself is the product.
Do these statistics apply to luxury listings?
Partly. The buyer-behavior numbers — nearly all buyers searching online, most wanting virtual tours, staging helping buyers picture the home — hold across price bands, and in fact matter more at the top of the market where the buyer pool is thinner and out-of-state. The production expectations differ: a $2M+ listing benefits from filmed footage, drone work, and a considered edit, which is where a hybrid workflow wins. Shoot the flagship property with a crew, then use AI assembly for the rest of the portfolio so every listing gets motion instead of only the expensive ones.
The Bigger Picture
The 2026 numbers tell one story with two halves. On one side, adoption: about half of Realtors are using AI weekly, three quarters are on social, and video is standard in general marketing. On the other side, coverage: most listings still go live without a walkthrough, because filming and editing cost more time than a listing schedule allows.
That gap is closing from the production end, not the demand end. Buyers were never the obstacle — they have wanted video for a decade. The obstacle was that making one meant a shoot day, an editor, and a three-day turnaround. When the same photo set that produces your listing stills can also produce a branded walkthrough, a vertical social cut, and a twilight exterior, the reason to skip video disappears. That is the shift the numbers above are describing, and it is the reason video coverage is about to stop being a differentiator and start being a baseline.
If you want to see where your own listings land, run one property through the pipeline and compare its inquiries against your last photo-only listing. Start with VideoGuru — upload a photo set, review the assembled walkthrough, and decide from your own numbers rather than anyone else’s.